Introducing Connector Private Networking: Join The Upcoming Webinar!
Building a Clickstream Dashboard Application with ksqlDB and Elasticsearch
Get started with Confluent, for free
Watch demo: Kafka streaming in 10 minutes
Using a powerful, event-driven application can help you unlock insights contained in the event streams of your business.
Before we get into the technology, let’s go over some questions you need to answer in order to build an event-driven application with streaming data:
- What are your key indicators?
- Over what time frames and aggregations do you need these indicators?
- What’s the best way for you to view the results?
This blog post shows you how to answer these questions with ksqlDB, Kafka Connect, and Elasticsearch by walking through the components of the clickstream demo. The clickstream demo is an excellent showcase for building a powerful, event-driven application with Confluent Platform doing most of the heavy lifting.
Imagine you have an online store and you want to analyze the shopping behavior of the visitors to your site. Like any responsible business owner, you are concerned with providing the best possible service for your potential customers. Some of the actions you want to track are:
- User activity over a given time frame: how many webpages are users viewing
- Requests that end in error over a given threshold (404 HTTP code)
- Where the requests are coming from geographically in a given window of time
- How long users are interacting with the site (user sessions)
Collecting this information is just the first step. To make the information useful, you need a way to analyze and make sense of the data quickly. In other words, you want to connect your collected data with some sort of data sink that enables swift analysis.
As a business owner, you want to focus on your business at hand and not have to spend a lot of time or money developing such a solution. To do so, you need to develop declaratively versus imperatively, meaning you need to specify only what you want instead of having to say how all of the work needs to get done.
You also need to quickly test everything end to end using simulated data, without having to spend even more development time just to create test data.
Looking at all of the requirements above, it might seem like a tall order to fill! But read on to see how you can meet all of these requirements and have fun along the way.
Check out the clickstream demo
Here are the steps you need to take to get started with the clickstream demo:
- Clone the repo: git clone git@github.com:confluentinc/examples.git confluentinc-examples
- After cloning, execute: cd confluentinc-examples/clickstream
- Then execute: git checkout latest
The following sections go through each of the requirements listed above and show how to fulfill each one from the corresponding part of the clickstream demo.
Gathering the clickstream data
The first step is to gather the required information about your site users and their activity. If you look at the clickstream/ksql/ksql-clickstream-demo/demo/statements.sql file, you’ll see all of the ksqlDB statements needed to fulfill your requirements. This blog post won’t go over each statement in detail, just the ones that directly implement your requirements.
The first statement that creates a stream from the clickstream topic is:
CREATE STREAM clickstream (_time bigint,time varchar, ip varchar, request varchar, status int, userid int, bytes bigint, agent varchar) with (kafka_topic = 'clickstream', value_format = 'json');
Below is a sample of the records from the clickstream topic:
222.173.165.103	{"ip":"222.173.165.103","userid":19,"remote_user":"-","time":"3251","_time":3251,"request":"GET /site/user_status.html HTTP/1.1","status":"302","bytes":"4096","referrer":"-","agent":"Mozilla/5.0 (compatible; Googlebot/2.1; +http://www.google.com/bot.html)"}
233.145.28.144	{"ip":"233.145.28.144","userid":14,"remote_user":"-","time":"3261","_time":3261,"request":"GET /site/user_status.html HTTP/1.1","status":"405","bytes":"2048","referrer":"-","agent":"Mozilla/5.0 (compatible; Googlebot/2.1; +http://www.google.com/bot.html)"}
111.173.165.103	{"ip":"111.173.165.103","userid":10,"remote_user":"-","time":"3271","_time":3271,"request":"GET /site/user_status.html HTTP/1.1","status":"406","bytes":"1289","referrer":"-","agent":"Mozilla/5.0 (Windows NT 10.0; Win64; x64) AppleWebKit/537.36 (KHTML, like Gecko) Chrome/59.0.3071.115 Safari/537.36"}
You can view these records by running the ksqlDB print topic command found in step 3 of the clickstream demo instructions.
This ksqlDB statement creates the base stream of events from the clickstream topic; you’ll need to do further analysis.
Next, take a look at this statement:
CREATE TABLE pages_per_min AS SELECT userid, WINDOWSTART as EVENT_TS, count(*) AS pages FROM clickstream WINDOW HOPPING (size 60 second, advance by 5 second) WHERE request like '%html%' GROUP BY userid;
The pages_per_min table represents the count of web pages requested by users, which is placed in a window of one-minute intervals and moves forward every five seconds, aka a hopping window. This statement fulfills your inquiry regarding user activity over a time frame. A hopping window is a time-based window with a fixed size and a defined advance interval. As a result, it may contain overlapping data, as the advance interval is smaller than the total window size.
One thing to take note of is the WINDOWSTART column in the CREATE table statement. The WINDOWSTART column represents the starting timestamp of the window capturing the user page views, and since it’s a hopping window, the timestamp will advance by five seconds for each updated count.
For your second inquiry item, requests that end in error, you have this statement:
CREATE table ERRORS_PER_MIN AS SELECT status, WINDOWSTART as EVENT_TS, count(*) AS errors FROM clickstream window HOPPING ( size 60 second, advance by 5 second) WHERE status > 400 GROUP BY status;
Again, you’re creating a windowed table that shows the error count of the past 60 seconds and moves forward by five seconds based on the timestamps of the events.
To get a sense of where your requests are coming from, the third item on your list, create another stream:
CREATE STREAM USER_CLICKSTREAM AS SELECT userid, u.username, ip, u.city, request, status, bytes FROM clickstream c LEFT JOIN web_users u ON c.userid = u.user_id;
Notice that the demo creates this stream as a join over the web_users table, which can be considered more of a lookup table with mostly static data versus a table with continual updates, like one of the activity count tables created above. It’s important to note that this statement executes the join on a ksqlDB table, as opposed to a remote call to an external database. The significance of using a ksqlDB table is that lookup is local, hence you don’t incur any latency that is associated with remote calls.
Finally, to track how long users are interacting with your site, create the following statement:
CREATE TABLE CLICK_USER_SESSIONS AS SELECT username, WINDOWSTART as EVENT_TS, count(*) AS events FROM USER_CLICKSTREAM window SESSION (30 second) GROUP BY username;
The CLICK_USER_SESSIONS measures user activity by sessions. Session windows are different because they track user behavior. For the purpose of this demo, if a user is inactive for 30 seconds or more, any subsequent action is considered a new session. So if a user’s activity occurs more frequently than 30 seconds per click, their session will continue to grow regardless of how long it lasts. The length of the session window is different from other windows that are time based (tumbling or hopping windows). With time-based windows, once the timestamp on the data passes the time frame established by the window, a new window is created for the events.
Session windows give you a good feel for how long users are interacting with your site, while time-based windows provide you with insight into what activity occurs at a given time. From the work you’ve done so far, you may have noticed the relationship between an event stream and a database table. While a discussion on the duality of streams and tables is not the point of this blog post, you may be interested in this series of blog posts by Michael Noll covering the relationship between streams and tables in depth.
Up to this point and with just a handful of SQL statements, you’ve been able to quickly create the streams and tables required for your site analysis. If you were to extend this example and use ksqlDB in Confluent Cloud, then you could build your cloud-native application with just a few queries in a console, which is a powerful concept.
Now that you have your analytics in place, let’s move on to how you can view the data you are collecting.
Viewing the event story
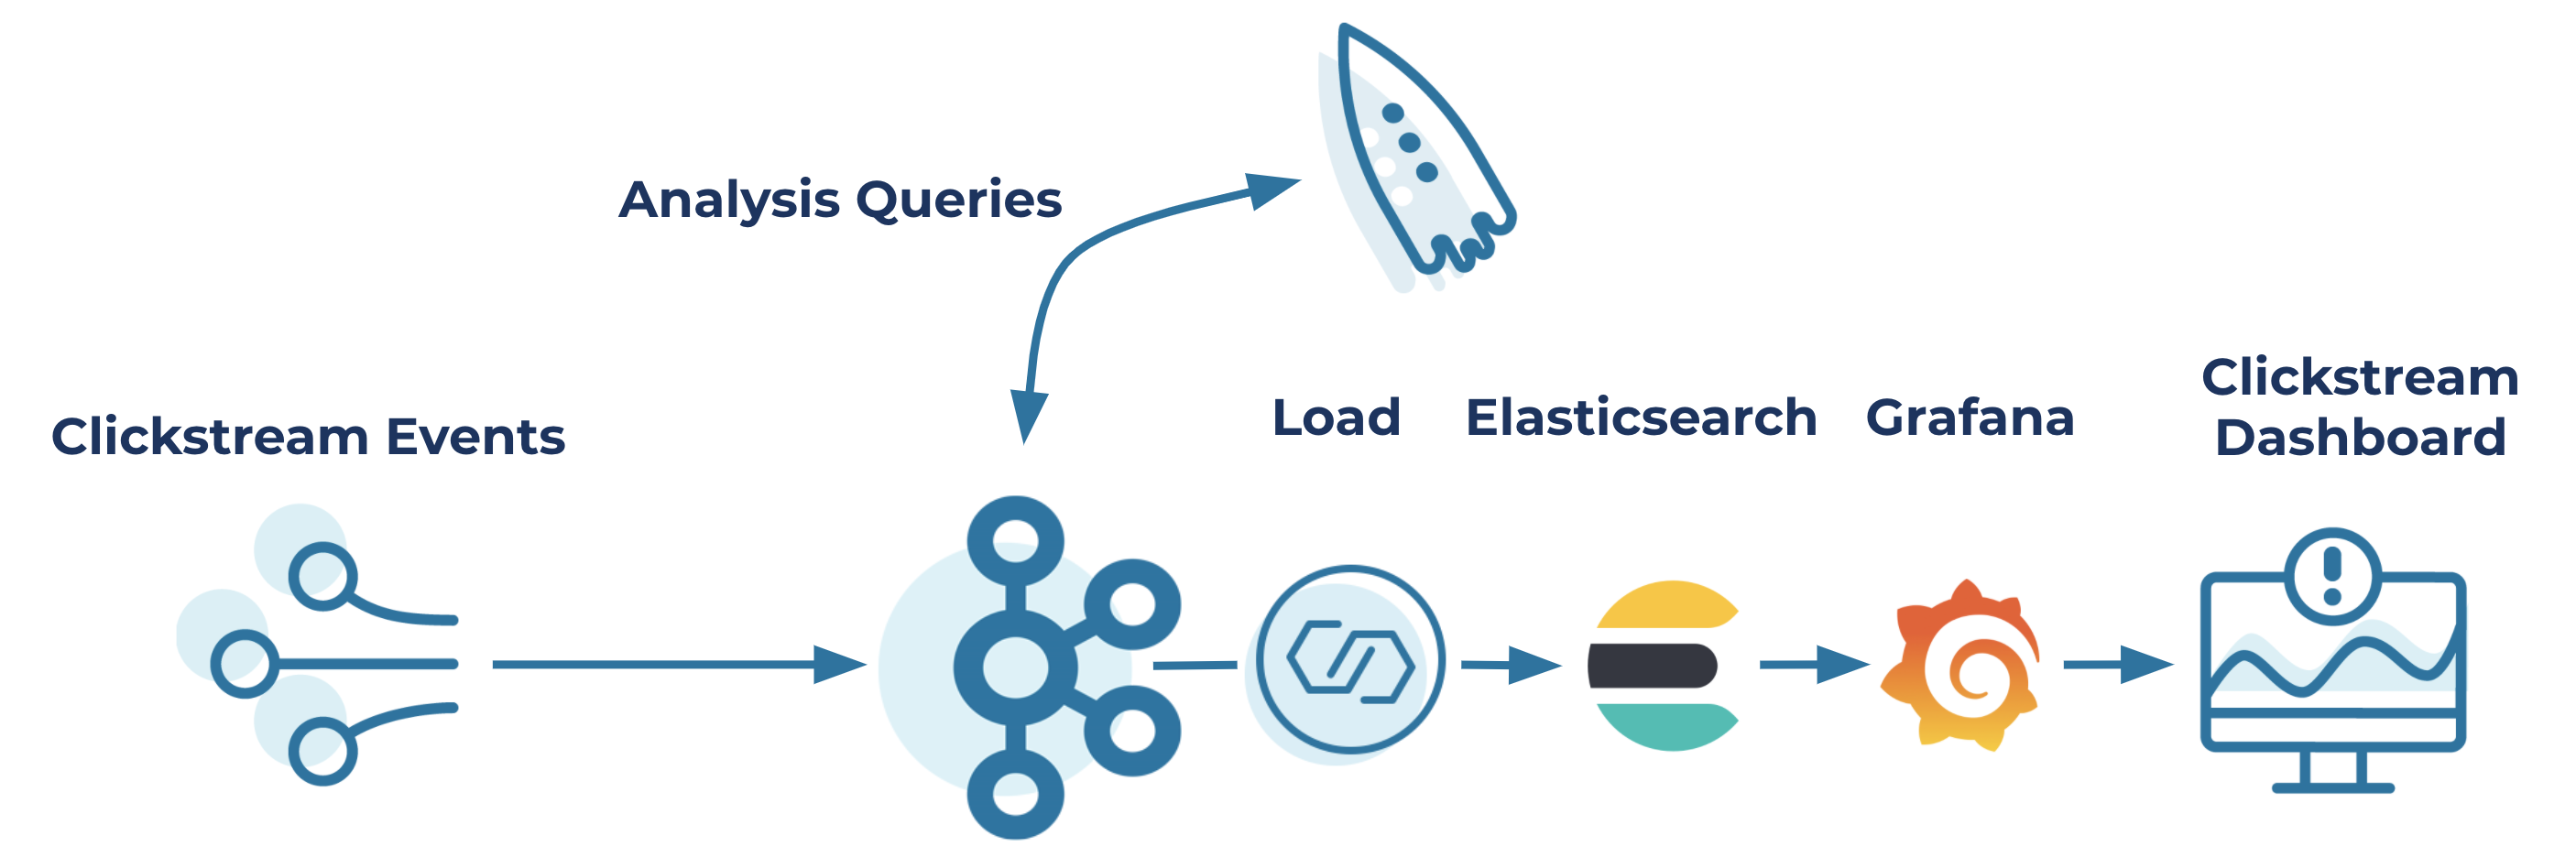
The next step in your journey is to make the event streaming data available for viewing. After all, to make your analysis useful, you need to be able to see it. To enable this, use the Kafka Connect Elasticsearch Connector. The Elasticsearch sink connector makes it simple to get all streaming events and table updates exported to Elasticsearch. This enables either searching or connecting to an analytics or monitoring service to display your analysis in real time.
Now before assuming you need to manage another component, think again. The ksqlDB server embeds a Connect worker, so you get Kafka Connect functionality built-in. The built-in Connect worker gives you the ability to push your event streaming results into another datastore without having to install and manage an additional component.
At this point, you need to export all of the table records created in the SQL statements above into Elasticsearch so you can view the results in real time. Fortunately, with the embedded Connect workers, it’s as simple as making a REST API call to the embedded Connect worker. Here’s an example of the connector configuration for the REST POST call that the script makes:
 "config": {
    "schema.ignore": "true",
    "topics": "'$TABLE_NAME'",
    "key.converter": "org.apache.kafka.connect.storage.StringConverter",
     "connector.class": "io.confluent.connect.elasticsearch.ElasticsearchSinkConnector",
    "key.ignore": "true",
    "value.converter": "org.apache.kafka.connect.json.JsonConverter",
"value.converter.schemas.enable": false,
   "type.name": "type.name=kafkaconnect",
    "topic.index.map": "'$TABLE_NAME':'$table_name'",
    "connection.url": "http://'$ELASTIC_HOST':9200",
    "transforms": "FilterNulls",
    "transforms.FilterNulls.type": "io.confluent.transforms.NullFilter"
  }
As you can see, in the JSON you specify the topic that Kafka Connect will use as the source of data for the particular Elasticsearch index. Of all the parameters in the JSON request, the most important one is the connector.class configuration. Here, it’s specifying the use of the ElasticsearchSinkConnector, which means the records from the table specified in the config get written to an Elasticsearch index of the same name. The script in the demo makes a REST API call for each table created by your SQL statements.
With the script running to start the connector tasks, you now have your streaming table updates exported over to Elasticsearch as the table updates occur. The final stage of this pipeline is to connect Grafana to the Elasticsearch indices for rendering in a browser. By using Grafana, you can view the results as they travel from ksqlDB to Kafka Connect to the Elasticsearch pipeline.
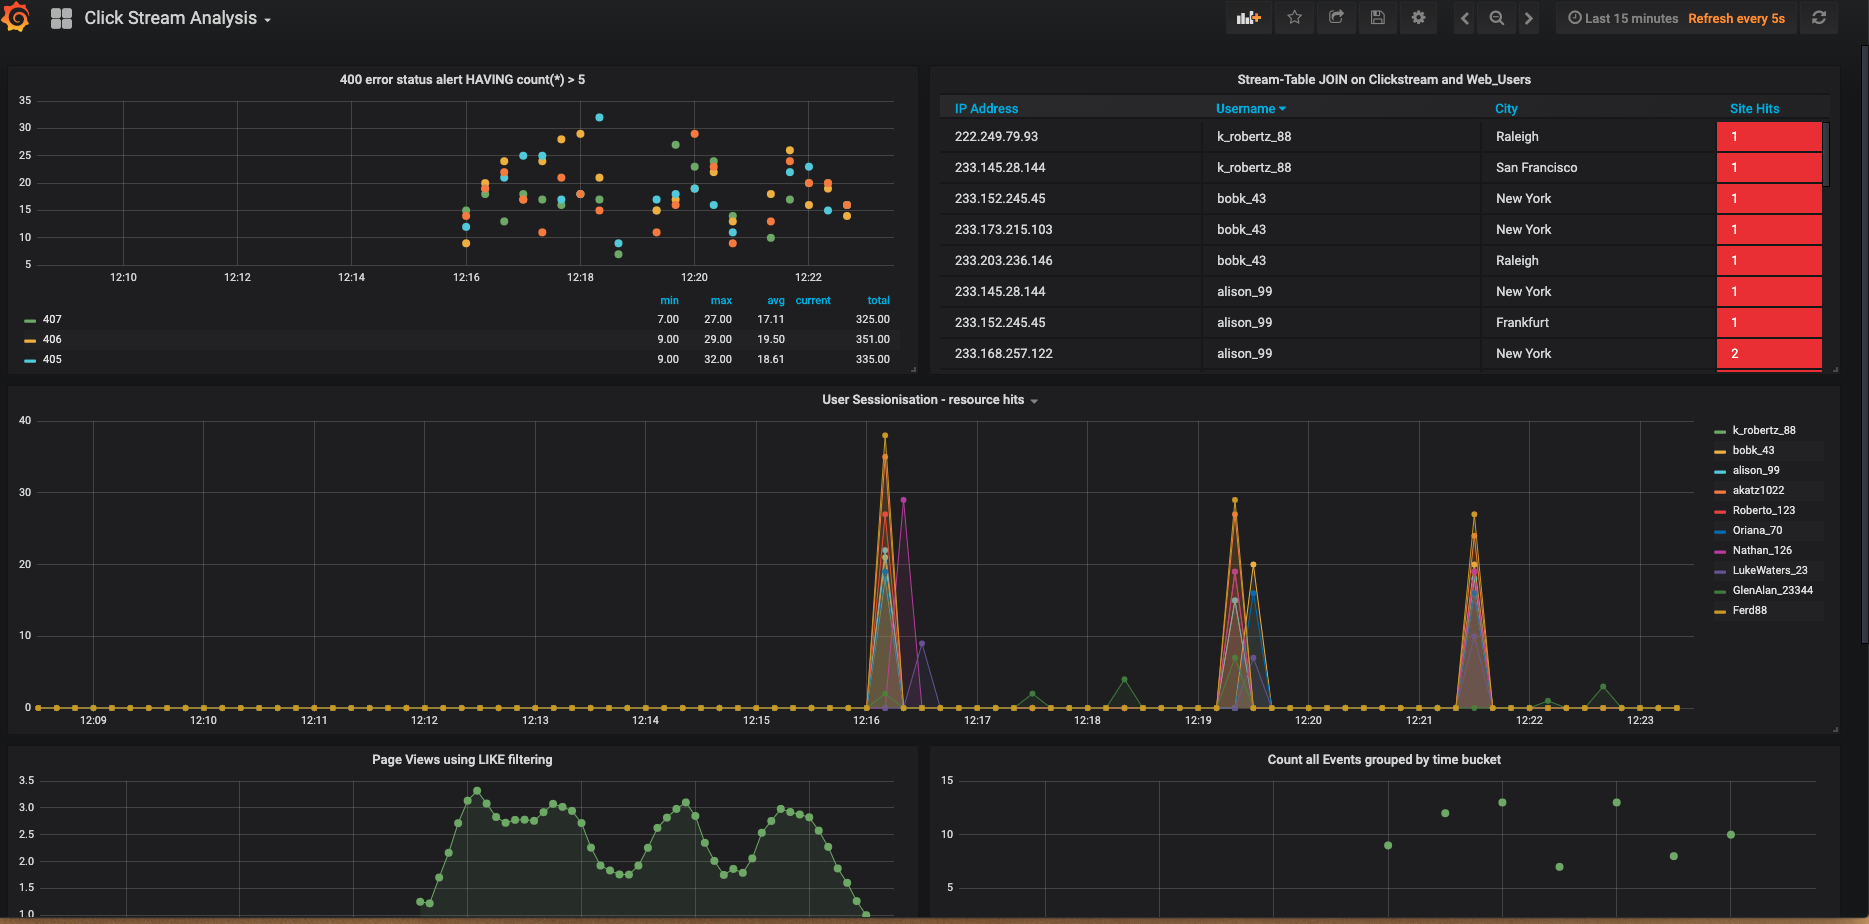
At this point, you have enabled powerful functionality without too much effort. For the price of a handful of SQL queries and some REST API calls, you have a live dashboard of event streams. Although the clickstream demo was set up in advance, you still needed to execute the steps to run it. You didn’t have to write any code; you simply ran some steps, and gained insight into your data. Here’s how your clickstream application will look in the end:
Testing your setup
You need a live stream of events to run your application, and this is true of the clickstream demo as well. But you aren’t going to build your event-based application and deploy immediately to production; you’ll first want to use test data to fine-tune your approach and setup. Getting realistic test data can be a challenge, but you also don’t want to invest too much time in developing it either.
The clickstream demo uses embedded Kafka Connect data generators for the demo. While this is to give the demo something to run and observe, it also serves as a demo within a demo on how to set up your application with test data using virtually no effort.
Using the Kafka Connect Datagen Connector
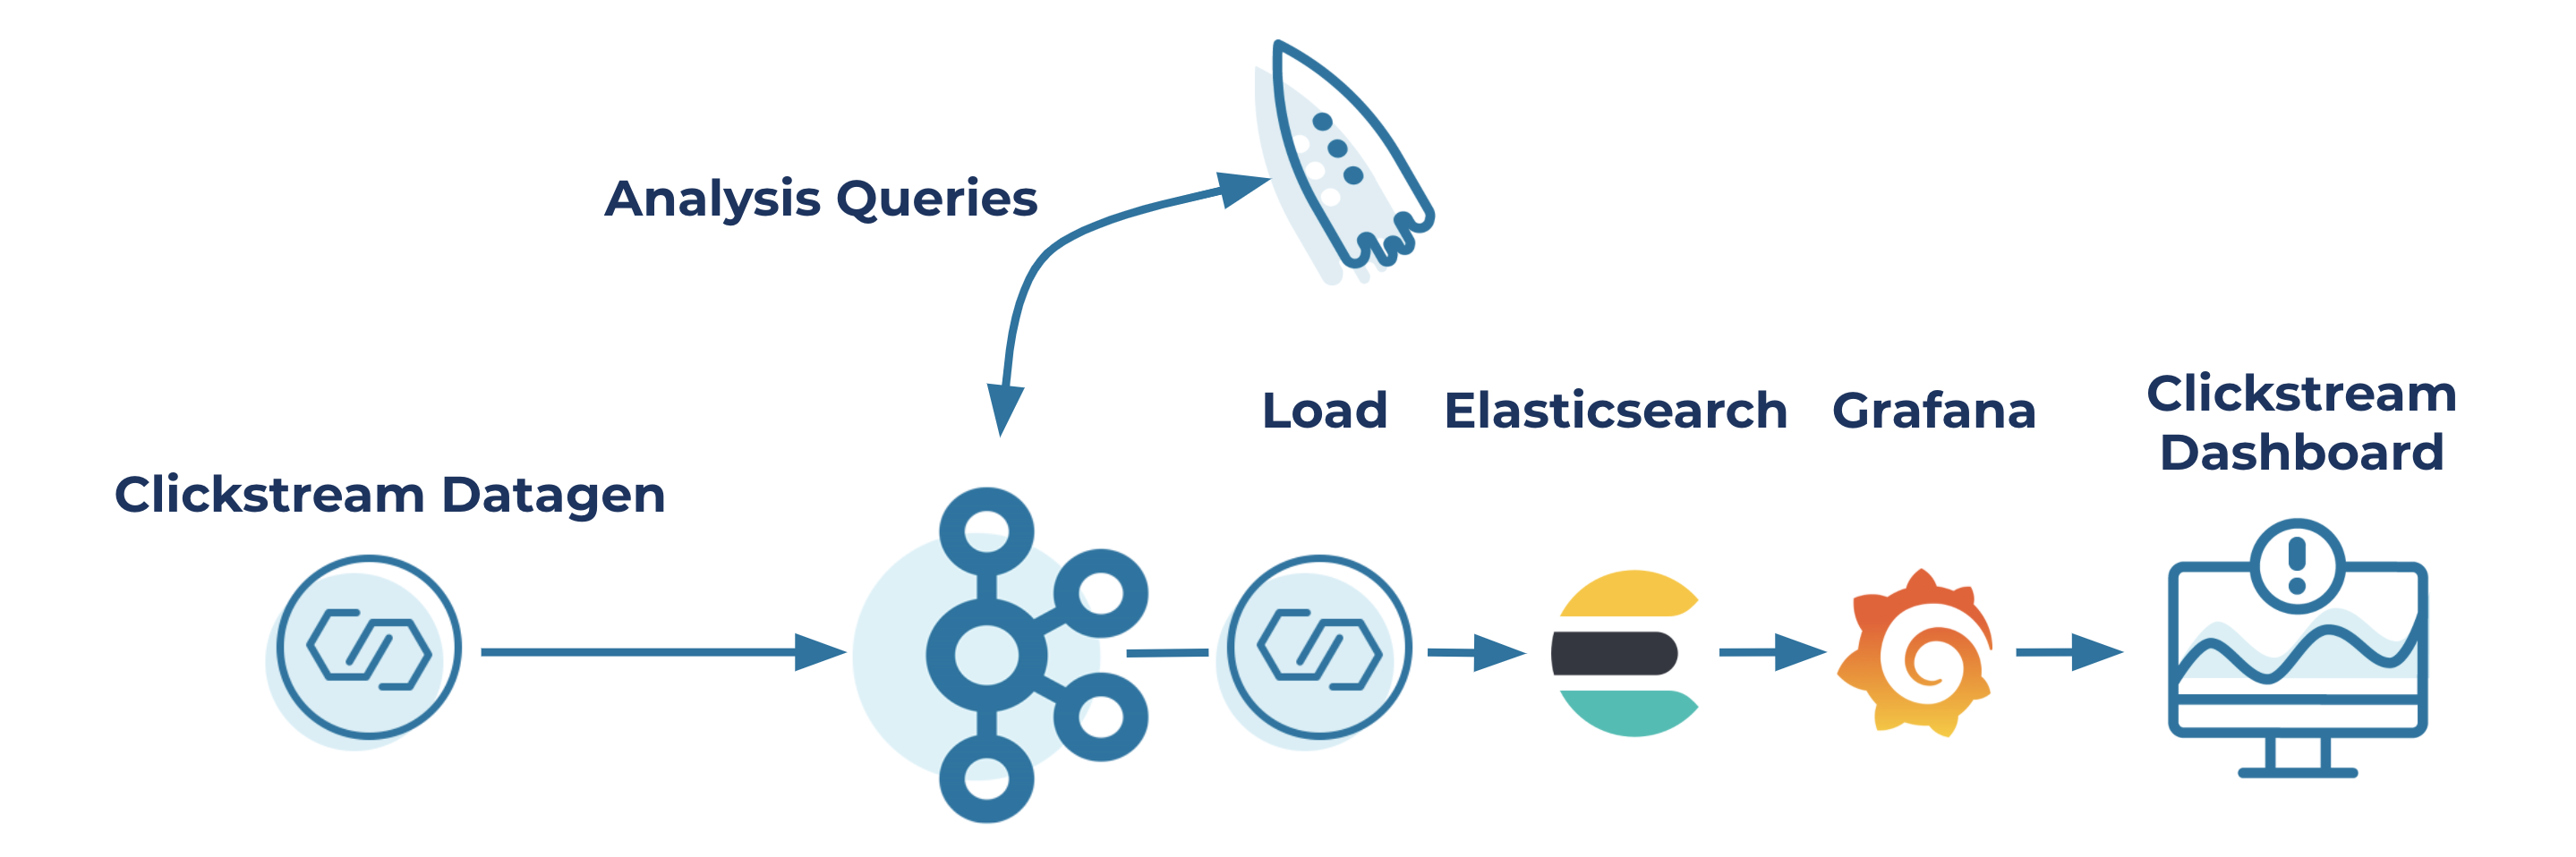
You’ve already seen the power of using Kafka Connect in the clickstream demo. Using the Elasticsearch sink connector, you can create a pipeline from your ksqlDB tables to Elasticsearch indices for display on a dashboard. You can also use the power of Kafka Connect to generate data as well with the Kafka Connect Datagen Connector. Kafka Connect has two types of connectors: source connectors and sink connectors. Source connectors read from an external source and put data into Apache Kafka®, and sink connectors do the opposite—they take records from Kafka and write them to external systems (e.g relational databases, filesystems, and Amazon S3).
The Kafka Connect Datagen Connector is a source connector without a source, so to speak. It generates the data sent into Kafka, which is brilliant!
Enabling the Kafka Connect Datagen Connector requires you to have Connect running. But as you saw earlier, ksqlDB server has embedded Kafka Connect workers, so getting the datagen connector running is a simple matter of issuing some SQL statements to ksqlDB to get data flowing into your application. The commands to get the datagen connector working for clickstream are:
 CREATE SOURCE CONNECTOR datagen_clickstream WITH (
  'connector.class'          = 'io.confluent.kafka.connect.datagen.DatagenConnector',
  'kafka.topic'              = 'clickstream',
  'quickstart'               = 'clickstream',
  'maxInterval'              = '30',
  'format'                   = 'json')
The datagen connector comes with some pre-configured data scenarios that it will generate, and that’s what you are using here with the clickstream data scenario. While it’s entirely possible to configure the datagen connector to create an almost infinite combination of test data, we won’t go into details here. Information on how to configure the datagen connector is covered in this blog post: Easy Ways to Generate Test Data in Kafka.
Summary and next steps
This blog post showed how to build an event-driven application that can run continuous queries over an event stream of incoming records. Additionally, you saw how to export the results of your continuous queries to an external system (Elasticsearch) using the embedded Elasticsearch sink connector with a simple REST call.
Are you ready to check ksqlDB out? Head over to ksqlDB.io to follow the quick start, read the docs, and learn more!
Get started with Confluent, for free
Watch demo: Kafka streaming in 10 minutes
Avez-vous aimé cet article de blog ? Partagez-le !
Abonnez-vous au blog Confluent


Introducing Versioned State Store in Kafka Streams
Versioned key-value state stores, introduced to Kafka Streams in 3.5, enhance stateful processing capabilities by allowing users to store multiple record versions per key, rather than only the single latest version per key as is the case for existing key-value stores today...


Delivery Guarantees and the Ethics of Teleportation
This blog post discusses the two generals problems, how it impacts message delivery guarantees, and how those guarantees would affect a futuristic technology such as teleportation.